SynchroTrace: Difference between revisions
No edit summary |
|||
| Line 1: | Line 1: | ||
<anyweb> http://dpac.ece.drexel.edu/current-research-projects/synchrotrace/ </anyweb> | <anyweb> http://dpac.ece.drexel.edu/current-research-projects/synchrotrace/ </anyweb> | ||
<anyweb> http://webapps.coe.drexel.edu/forms/computing-for-power-and-energy </anyweb> | |||
The above page is embedded from Prof. Mark Hempstead's webpage | The above page is embedded from Prof. Mark Hempstead's webpage | ||
Revision as of 11:51, 7 April 2015
<anyweb> http://dpac.ece.drexel.edu/current-research-projects/synchrotrace/ </anyweb> <anyweb> http://webapps.coe.drexel.edu/forms/computing-for-power-and-energy </anyweb>
The above page is embedded from Prof. Mark Hempstead's webpage
SynchroTrace
SynchroTrace is a two-step trace-driven simulation methodology that enables efficient design space exploration of CMPs. The first step, capturing synchronization-aware traces of multi-threaded applications, leverages an extension of prior work (Sigil). The second step represents an timing model for replaying the synchronization-aware traces into external architecture models. Together, these two stages represent ‘SynchroTrace’.
To leverage this methodology for design space exploration, we have developed a prototype of SynchroTrace integrated into the cache and NoC simulators of Gem5 (Ruby and Garnet, respectively). We defined this prototype integration as the SynchroTrace Simulation Framework, and the code for this framework is available below.
Overview:
The capture tool is built from Sigil, which leverages the Valgrind dynamic binary instrumentation tool. The processed instructions from the native multi-threaded applications are abstracted into (3) events: Computation (Work performed local to a thread), Communication (Read/Write dependencies between threads), and Synchronization (embedded pthread calls for each thread). These events form a trace for each individual thread, so that these threads may progress in parallel when replaying the traces.
Computation Event (indicated by the $ and * symbols): [Thread ID, Event Number, Number of Integer Operations, Number of Floating Point Operations, Number of Memory Reads, Number of Memory Writes $ Range of Unique Addresses Written * Range of Unique Addresses Read]
Communication Event (indicated by the # symbol): [Thread ID, Event Number # Producer Thread ID, Produce Event Number, Range of Unique Addresses Read]
Synchronization Event (indicated by the pth_th and ^ symbol): [Thread ID, Event Number, pth_ty: Pthread Call Type ^ Address of Synchronization Structure]
Replay Model:
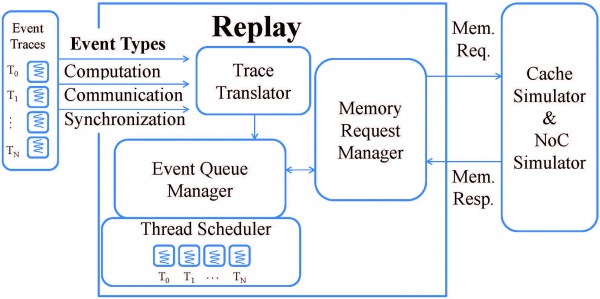
Traces are fed into the replay timing model, which acts as an interface into the external architecture models.
replay_diagram
The Replay portion of SynchroTrace is comprised of 4 entities:
Trace Translator – Converts the traces into an event form to be fed into the timing model.
Event Queue Manager – Centralized event queue that manages the timing of thread progression based on the three types of events. The Event Queue Manager also handles the timing for when to send memory requests to the external cache simulator.
Thread Scheduler – Creates and maintains the thread state. The Thread Scheduler includes a light-weight swapping mechanism to allow for multiple threads to run on a core. The scheduler also handles the appropriate synchronization actions.
Memory Request Manager – Interface to the external architecture models. For the SynchroTrace Simulation Framework, the memory request manager packages the memory requests into requests for Ruby.
Getting SynchroTrace:
The SynchroTrace Simulation Framework is accessible through GitHub at: https://github.com/dpac-vlsi
Currently, there is only a repository for playing the synchronization-aware traces into the external cache and NoC models (Ruby and Garnet). We’ve included a few sample traces to test and explore this code-base. We are currently prepping the capture tool for release very soon.
The SynchroTrace publication can be found here.
Dependencies:
The SynchroTrace Simulation Framework is integrated into Gem5′s cache and NoC simulators (Ruby and Garnet). Thus, SynchroTrace’s dependencies are based on Gem5′s dependencies. Please refer to http://www.gem5.org/Dependencies for more information.
SynchroTrace has been tested on Intel Xeon E5-based machines, running either RedHat Enterprise Linux 5, Centos 6, or Ubuntu 12.x operating systems. We have generated traces for PARSEC and Splash-2 benchmarks (up to 64 threads reliably) and ran them through our SynchroTrace Simulation Framework.
Running the first time:
Please follow the included Readme to compile SynchroTrace and run the sample traces for the first time.
